Q3FY2019 Result Update | Banking
Feb 14, 2019
Axis Bank
BUY
CMP
`697
Performance Highlights
Target Price
`860
Particulars (` cr)
Q3FY19
Q2FY19
% chg (qoq)
Q3FY18
% chg (yoy)
Investment Period
12 Months
NII
5,604
5,232
7.1
4,732
18.4
Stock Info
Pre-prov. profit
5,525
4,094
34.9
2,811
96.5
PAT
1,681
790
112.8
726
131.3
Sector
Banking
Source: Company, Angel Research
Market Cap (` cr)
1,79,205
Beta
1.1
For Q3FY2019, Axis Bank reported PAT of `1,681cr, which is the highest in past
52 Week High / Low
734/477
11 quarters. This was supported by steady NII growth (18.4% yoy), and recovery
Avg. Daily Volume
1,84,725
of `998cr from written off accounts.
Face Value (`)
2
Retails loan drive loan growth momentum; NIM improved marginally: During
BSE Sensex
36,034
Q3FY2019, the bank’s advances grew by 13% yoy, with retail and SME growing
Nifty
10,793
at 20% yoy and 13.4% yoy respectively. The NII during this period grew by 18.4%
Reuters Code
AXBK:NS
yoy, led by advances growth and improvement in NIM. Uptrend in NIM over last
Bloomberg Code
AXSB:NATL
3 quarters was led by corporate book coupled with re-pricing of marginal cost of
funds based lending rate (MCLR) linked loans (60bps increase in MCLR in 3Q).
The return of pricing power owing to lesser competition from NBFCs and
Shareholding Pattern (%)
improving asset quality will support NIM.
Promoters
23.7
MF / Banks / Indian Fls
15.8
Elevated slippages; fresh accretion of NPA to be moderate going ahead:
Annualised slippages for Q3FY2019 was tad higher at 3.2%. However, we expect
FII / NRIs / OCBs
47.2
fresh accretion of NPA to be lower owing to (1) sub investment book has declined
Indian Public / Others
13.2
by 72% from Q1FY2017 and now stands 1.6% of advances; (2) management
stated elevated downward cycle is nearing an end; (3) PCR including technical
write-offs at 75%, bank has taken additional contingent provisions of `600cr for
Abs. (%)
3m 1yr
3yr
potential downgrade from sub investment book.
Sensex
4.5
6.1
58.6
Management guides for 18% ROE in the medium term: The bank's MD & CEO
has given ROE target of 18% in medium term, which will be driven by strong
Axis Bank
14.2
28.7
78.4
growth momentum in the retail segment and pick up in its corporate book
through improved product mix, better operating efficiency, and reduction in credit
costs to below its long-term average via improvement in asset quality.
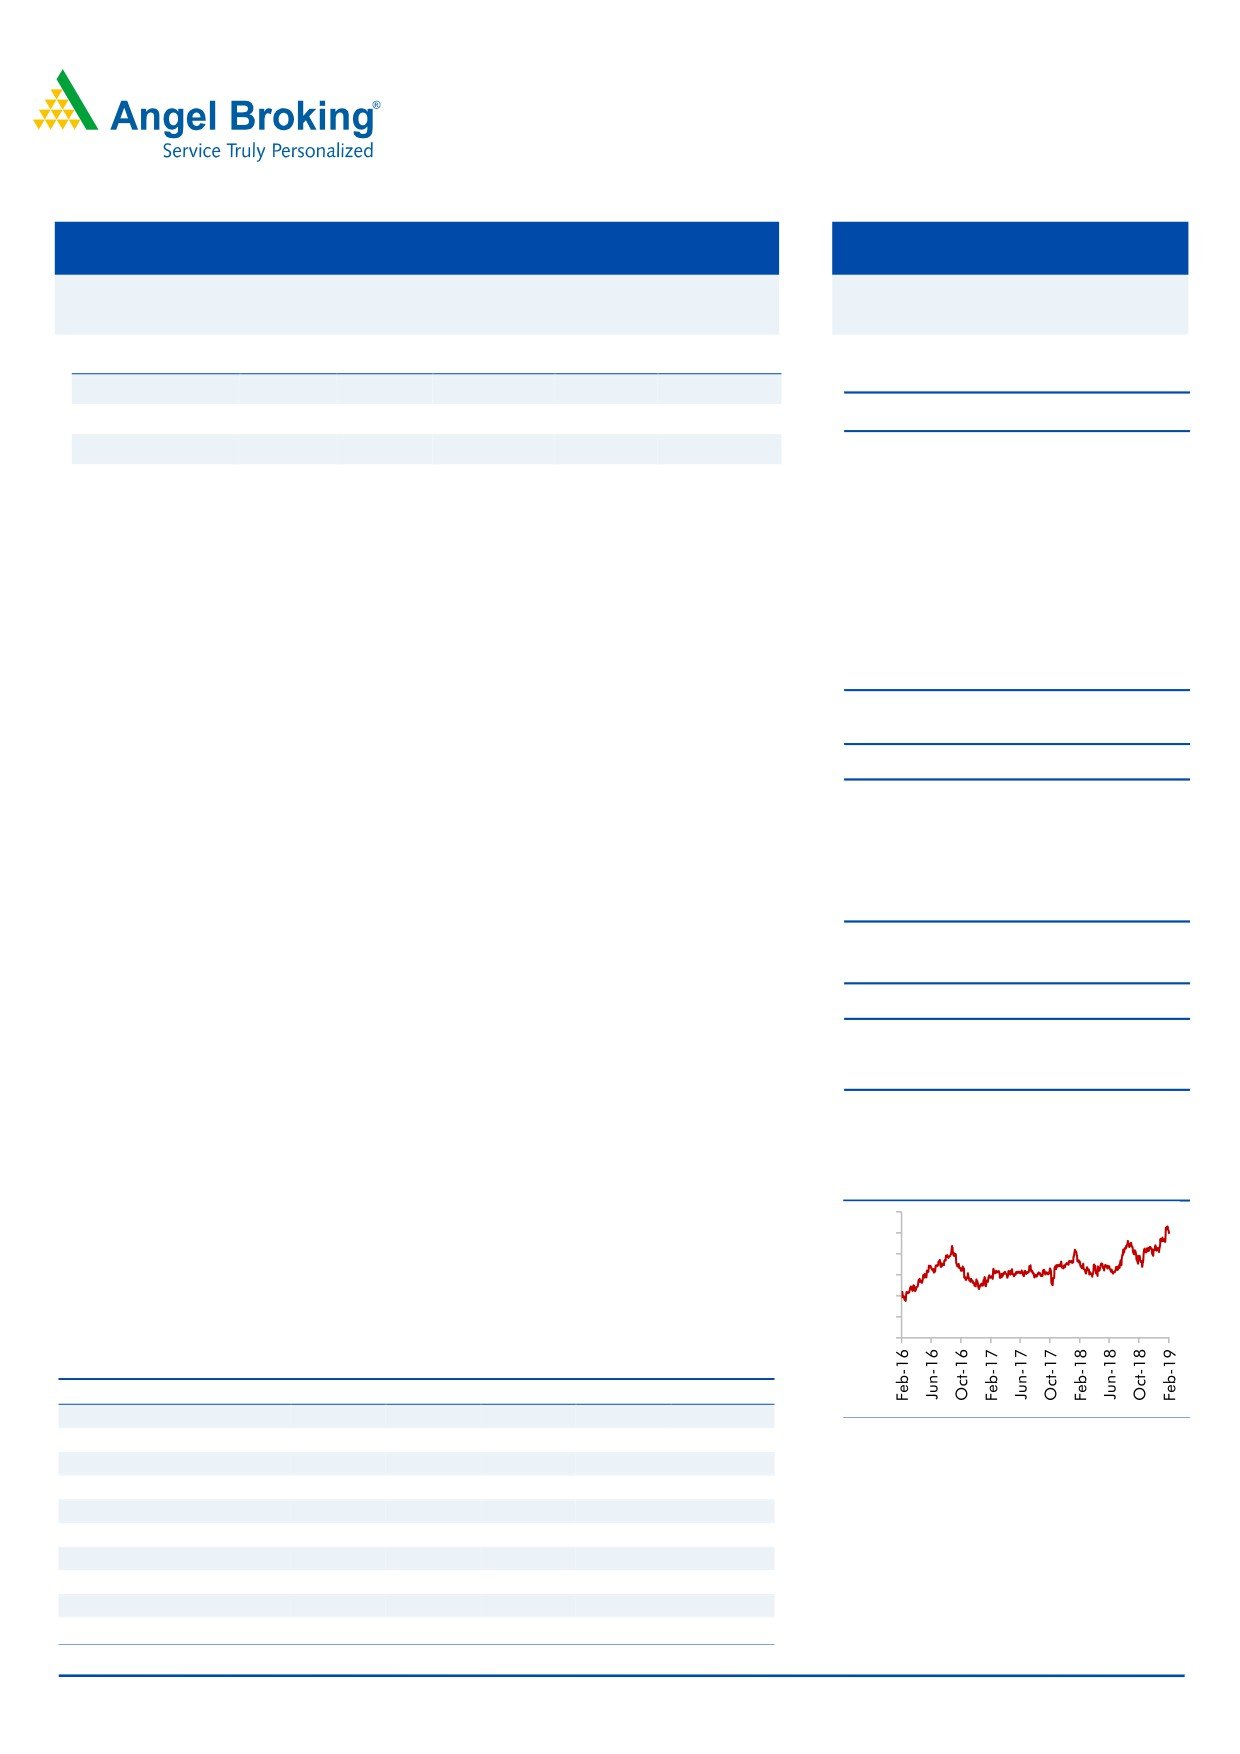
3-year price chart
Outlook & Valuation: Axis Bank currently trades at 2.1x its FY2021E price to book
800
value (after adjusting value of subsidiaries). We expect the stock to get re-rated
700
600
owing to (1) new leadership; (2) limited stressed loan pool; (3) improvement in
500
return ratios (ROA/ROE - 1.1%/12.2% by FY2020E). We recommend Buy on the
400
300
stock with a Target Price of `860.
200
Exhibit 1: Key Financials
Y/E March (` cr)
FY17
FY18
FY19E
FY20E
FY21E
NII
18,093
18,618
21,882
25,878
32,134
Source: Company, Angel Research
% chg
7
3
18
18
24
Net profit
3,679
276
4,694
8,678
10,784
% chg
-55
(93)
1,603
85
24
NIM (%)
3.4
3.1
3.2
3.3
3.6
Jaikishan Parmar
EPS (`)
14
1
18
34
42
P/E (x)
49
649
38
21
17
Research Analyst
P/ABV (x)
3.3
3.1
2.8
2.4
2.1
022 - 39357600 Ext: 6810
RoA (%)
0.6
0.0
0.6
1.0
1.1
[email protected]
RoE (%)
7
0
7
12
13
Note: CMP as of 13/2/19
Please refer to important disclosures at the end of this report
1
Axis Bank|Q3FY2019 Result Update
Exhibit 1: Quarterly Summary
Particular (` cr)
Q1FY18
Q2FY18
Q3FY18
Q4FY18
Q1FY19
Q2FY19
Q3FY19
YoY
QoQ
Interest Income
11,052
11,235
11,722
11,771
12,777
13,281
14,130
20.5
6.4
Interest Expenses
6,436
6,695
6,990
7,041
7,610
8,049
8,526
22.0
5.9
Net Interest Income (NII)
4,616
4,540
4,732
4,730
5,167
5,232
5,604
18.4
7.1
Other Income
3,000
2,586
2,593
2,789
2,925
2,678
4,001
54.3
49.4
Other income as % of TOI
39.39
36.29
35.40
37.09
36.15
33.86
41.65
625.3
779.6
Total Income
14,052
13,821
14,315
14,560
15,702
15,959
18,130
26.7
13.6
Net Income
7,616
7,125
7,325
7,519
8,092
7,910
9,604
31.1
21.4
Operating Expenses
3,325
3,348
3,471
3,847
3,720
3,816
4,080
17.5
6.9
Employee Expenses
1,088
1,083
1,063
1,079
1,228
1,175
1,203
13.1
2.4
Other Operating Expenses
2,237
2,265
2,408
2,768
2,492
2,642
2,877
19.5
8.9
Cost / Income %
43.66
46.99
47.39
51.16
45.97
48.25
42.48
-490.8
-576.8
Operating Profit
4,291
3,777
3,854
3,672
4,372
4,094
5,525
43.4
34.9
Provisions
2,342
3,140
2,811
7,180
3,338
2,927
3055
8.7
4.3
PBT
1,949
637
1,043
-3,507
1,034
1,167
2,470
136.9
111.7
Provisions for Tax
644
205
316
-1,319
333
377
789
149.5
109.4
Tax Rate %
33.0
32.1
30.3
37.6
32.2
32.3
34.0
366.5
168.4
PAT
1,306
432
726
-2,189
701
790
1,681
131.4
112.9
Profitability
YoY
QoQ
Change
bps
Yield Advance
8.66
8.45
8.44
8.14
8.73
8.88
9.13
69.1
25.4
Yield on Investment
7.15
6.80
7.14
6.95
6.96
7.22
7.31
16.7
8.8
Yield on RBI
1.63
1.37
1.36
1.52
1.58
1.94
1.89
53.4
-4.2
Yield on MM
9.24
18.22
19.26
17.96
14.25
13.40
12.52
-674.3
-88.6
Cost of Fund
4.94
4.98
5.08
4.89
5.07
5.25
5.30
22.5
5.4
NIM Cal
3.32
3.17
3.21
3.08
3.25
3.23
3.31
10.2
8.5
Spread
3.72
3.47
3.36
3.25
3.66
3.63
3.83
46.6
20.0
NIM Domestic Reported
3.60
3.59
3.50
3.59
3.61
1.0
2.0
NIM Global Reported
3.38
3.33
3.29
3.36
3.42
4.0
6.0
ROE
9.25
3.05
4.77
-13.57
4.39
4.89
10.21
543.1
531.8
Asset Quality
YoY
QoQ
GNPA%
5.03
5.90
5.28
6.77
6.52
5.96
5.75
47.0
-21.0
NPA%
2.30
3.12
2.56
3.40
3.09
2.54
2.36
-20.0
-18.0
Capital Adequacy
YoY
QoQ
Tier - 1
12.60
12.36
14.13
13.04
13.22
13.0
12.5
-165.0
-56.0
Tier - 2
4.03
3.96
3.87
3.53
3.49
3.4
3.3
-54.0
-8.0
Total
16.6
16.3
18.0
16.6
16.71
16.45
15.81
-219.0
-64.0
Source: Company
Feb 13, 2019
2
Axis Bank|Q3FY2019 Result Update
Exhibit 2: GNPA Movement
Particular (` cr)
Q1FY18
Q2FY18
Q3FY18
Q4FY18
Q1FY19
Q2FY19
Q3FY19E YoY QoQ
Advance Mix %
Corporate Banking
42.1
42.2
41.0
39.7
39.1
38.2
38.0 -300bp
-20bp
SME
12.4
12.9
13.0
13.4
12.9
13.2
13.0
0.0
-20bp
Retail
45.5
44.9
45.9
47.0
48.0
48.6
49.0
310bp
40bp
Advance Mix
Corporate Banking
1,62,284
1,73,197
1,72,744
1,74,446
1,72,443
1,74,149
1,80,469
4.5
3.6
SME
47,918
52,718
54,884
58,740
56,983
60,262
62,238
13.4
3.3
Retail
1,75,278
1,84,256
1,93,295
2,06,464
2,11,648
2,21,710
2,32,397
20.2
4.8
Total Advance
3,85,480
4,10,171
4,20,923
4,39,650
4,41,074
4,56,121
4,75,104
12.9
4.2
Placement& Debt Syndic
42,749
28,663
45,305
74,887
16,678
38,785
74,641
64.8
92.4
Balance Sheet
Total Advance
3,85,480
4,10,171
4,20,923
4,39,650
4,41,074
4,56,121
4,75,104
12.9
4.2
Deposits
3,93,741
4,16,431
4,08,967
4,53,623
4,47,079
4,79,680
5,14,092
25.7
7.2
Savings
1,22,010
1,30,265
1,31,219
1,48,202
1,41,359
1,48,742
1,51,380
15.4
1.8
Current
71,573
79,792
70,492
95,650
68,278
80,128
84,172
19.4
5.0
CASA
1,93,583
2,10,057
2,01,711
2,43,852
2,09,637
2,28,870
2,35,552
16.8
2.9
CASA%
49.17
50.44
49.32
53.76
46.89
47.71
45.82 -350bp -189bp
SA%
63.03
62.01
65.05
60.78
67.43
64.99
64.27
-78bp
-72bp
CA%
36.97
37.99
34.95
39.22
32.57
35.01
35.73
78bp
72bp
Term
2,00,158
2,06,374
2,07,256
2,09,771
2,37,442
2,50,810
2,78,540
34.4
11.1
Borrowings
1,29,527
1,35,405
1,40,874
1,48,016
1,52,227
1,48,399
1,44,669
2.7
-2.5
Source: Company
Exhibit 3: GNPA Movement
Axis Bank
2QFY17
3QFY17
4QFY17
1QFY18
2QFY18
3QFY18
4QFY18
1QFY19
2QFY19
3QFY19
GNPA Opening
9,553
16,379
20,467
21,280
22,031
27,402
25,001
34,249
32,662
30,938
Fresh Slippage
8,772
4,560
4,811
3,519
8,936
4,428
16,536
4,337
2,777
3,746
Slippage
2.5%
1.3%
1.3%
0.9%
2.2%
1.1%
3.8%
1.0%
0.6%
0.8%
Slippage Anl
9.9%
5.3%
5.2%
3.7%
8.7%
4.2%
15.0%
3.9%
2.4%
3.2%
Upgrade & Rec
1,073
350
2,804
306
1,048
4,008
3,401
2,917
2,186
1,622
Write off
873
122
1,194
2,462
2,517
2,821
3,887
3,007
2,315
2,207
Closing GNPA
16,379
20,467
21,280
22,031
27,402
25,001
34,249
32,662
30,938
30,855
Prov
8,618
12,172
12,654
12,265
13,350
13,232
17,657
17,760
18,222
18,622
NPA
7,761
8,295
8,626
9,766
14,052
11,769
16,592
14,902
12,716
12,233
Prov for Qtr
3,623
3,796
2,581
2,342
3,140
2,811
7,180
3,338
2,927
3,055
CC
1.0%
1.1%
0.7%
0.6%
0.8%
0.7%
1.6%
0.8%
0.6%
0.6%
CC Ann
4.1%
4.4%
2.8%
2.4%
3.1%
2.7%
6.5%
3.0%
2.6%
2.6%
Source: Company
Feb 13, 2019
3
Axis Bank|Q3FY2019 Result Update
Exhibit 4: SOTP Valuation Summary
Particular
Stake in Company%
Target Multiple
Value/Share `
Core Business
100
2.5x FY21E ABV
829.4
Axis Capital Ltd
100
15x FY21E PAT
9.9
Axis MF
75
15x FY21E PAT
3.0
Axis Fin
100
1.5x FY21E BV
10.8
Axis Sec
100
15x FY21E PAT
5.3
Sum of Parts Value
860
Source: Company
Exhibit 5: 1 year Froward P/ABV Band
5.0
P/BV
Avg. P/BV
+1STD
-1STD
4.5
3.8
4.0
3.5
2.9
3.0
2.5
2.32
2.5
2.0
1.5
1.7
1.0
1.1
0.5
0.0
Source: Company
Exhibit 6: DuPont Analysis
Particular
FY12
FY13
FY14
FY15
FY16
FY17
FY18
FY19E
FY20E
FY21E
Interest Income
8.3
8.7
8.5
8.4
8.2
7.8
7.1
7.5
7.8
8.1
Interest Expenses
5.3
5.6
5.2
5.0
4.8
4.6
4.2
4.5
4.7
4.8
NII
3.0
3.1
3.3
3.4
3.4
3.2
2.9
3.0
3.1
3.3
- Prov
0.4
0.6
0.6
0.6
0.7
2.1
2.4
1.6
1.0
1.0
Adj NII
2.6
2.5
2.7
2.8
2.6
1.0
0.5
1.4
2.1
2.3
Other Income
2.1
2.1
2.0
2.0
1.9
2.0
1.7
1.7
1.7
1.6
Total Income
4.7
4.6
4.8
4.8
4.5
3.1
2.2
3.1
3.8
3.9
Opex
2.3
2.2
2.2
2.2
2.0
2.1
2.2
2.2
2.2
2.3
Emp
0.8
0.8
0.7
0.7
0.7
0.7
0.7
0.7
0.7
0.7
Other
1.5
1.4
1.5
1.4
1.3
1.5
1.5
1.5
1.5
1.6
PBT
2.4
2.4
2.6
2.6
2.5
1.0
0.0
0.9
1.6
1.7
TAX
0.8
0.8
0.9
0.9
0.8
0.3
-0.0
0.3
0.5
0.6
RoA
1.6
1.7
1.7
1.7
1.6
0.6
0.0
0.6
1.0
1.1
Leverage
12.6
11.2
10.1
10.2
10.2
10.5
10.8
11.2
11.5
11.8
RoE
20.3
18.5
17.4
17.8
16.8
6.8
0.5
7.1
12.0
13.2
Source: Company
Feb 13, 2019
4
Axis Bank|Q3FY2019 Result Update
Income Statement
Y/E March (` cr)
FY17
FY18
FY19E
FY20E
FY21E
Net Interest Income
18,093
18,618
21,882
25,878
32,134
- YoY Growth (%)
7
3
18
18
24
Other Income
11,691
10,967
12,777
13,866
15,575
- YoY Growth (%)
25
(6)
17
9
12
Operating Income
29,784
29,585
34,660
39,743
47,710
- YoY Growth (%)
14
(1)
17
15
20
Operating Expenses
12,200
13,990
15,956
18,411
21,712
- YoY Growth (%)
21
15
14
15
18
Pre - Provision Profit
17,585
15,594
18,703
21,332
25,997
- YoY Growth (%)
9
(11)
20
14
22
Prov. & Cont.
12,117
15,473
11,725
8,184
9,657
- YoY Growth (%)
227
28
-24
-30
18
Profit Before Tax
5,468
122
6,978
13,148
16,340
- YoY Growth (%)
-56
(98)
5,640
88
24
Prov. for Taxation
1,788
-154
2,284
4,470
5,556
- as a % of PBT
33
-127
33
34
34
PAT
3,679
276
4,694
8,678
10,784
- YoY Growth (%)
(55)
(93)
1,603
85
24
Balance Sheet
Y/E March (` cr)
FY17
FY18
FY19E
FY20E
FY21E
Share Capital
479
513
513
513
513
Reserves & Surplus
55,284
62,932
67,764
76,007
86,253
Net Worth
55,763
63,445
68,277
76,521
86,766
Deposits
4,14,379
4,53,623
5,17,130
5,99,871
7,07,848
- Growth (%)
16
9
14
16
18
Borrowings
1,05,031
1,48,016
1,68,738
1,94,049
2,27,037
Other Liab & Prov.
26,387
26,373
24,180
20,337
15,217
Total Liabilities
6,01,559
6,91,458
7,78,325
8,90,778
10,36,868
Cash balances
30,858
35,481
42,269
43,033
43,701
Bank balances
19,398
7,974
10,751
12,389
14,527
Investments
1,28,793
1,53,876
1,67,840
1,88,696
2,15,583
Advances
3,73,069
4,39,650
5,01,201
5,81,393
6,86,044
- Growth (%)
10
18
14
16
18
Fixed Assets
3,747
3,972
4,551
5,279
6,229
Other Assets
45,693
50,505
51,713
59,987
70,785
Total Assets
6,01,559
6,91,458
7,78,325
8,90,778
10,36,868
- Growth (%)
11
15
13
14
16
Feb 13, 2019
5
Axis Bank|Q3FY2019 Result Update
Key Ratio
Y/E March
FY17
FY18
FY19E
FY20E
FY21E
Profitability ratios (%)
NIMs
3.43
3.1
3.22
3.3
3.6
Cost to Income Ratio
41
47
46
46
46
RoA
0.6
0.0
0.6
1.0
1.1
RoE
7
0
7
12
13
B/S ratios (%)
CASA Ratio
51.4
53.8
53.8
53.8
53.8
Credit/Deposit Ratio
90
97
97
97
97
Asset Quality (%)
Gross NPAs
5.04
6.77
5.0
4.0
4.0
Net NPAs
2.11
3.40
2.3
1.7
1.7
Credit Cost
3.2
3.5
2.3
1.4
1.4
Provision Coverage
0.58
0.50
0.54
0.58
0.58
Per Share Data (`)
EPS
14
1
18
34
42
ABVPS (70% cover.)
208
222
250
287
338
DPS
5
5
5
5
5
Valuation Ratios
PER (x)
49
649
38
21
17
P/ABVPS (x)
3.3
3.1
2.8
2.4
2.1
Dividend Yield (%)
0.8
0.8
0.7
0.7
0.7
DuPont Analysis
Interest Income
7.8
7.1
7.5
7.8
8.1
Interest Expenses
4.6
4.2
4.5
4.7
4.8
NII
3.2
2.9
3.0
3.1
3.3
- Prov
2.1
2.4
1.6
1.0
1.0
Adj NII
1.0
0.5
1.4
2.1
2.3
Other Income
2.0
1.7
1.7
1.7
1.6
Total Income
3.1
2.2
3.1
3.8
3.9
Opex
2.1
2.2
2.2
2.2
2.3
PBT
1.0
0.0
0.9
1.6
1.7
TAX
0.3
-0.0
0.3
0.5
0.6
RoA
0.6
0.0
0.6
1.0
1.12
Leverage
10.5
10.8
11.2
11.5
11.8
RoE
6.8
0.5
7.1
12.0
13.2
Valuation done on closing price of13/2/19
Feb 13, 2019
6
Axis Bank|Q3FY2019 Result Update
Research Team Tel: 022 - 39357800
E-mail: [email protected]
Website: www.angelbroking.com
DISCLAIMER
Angel Broking Limited (hereinafter referred to as “Angel”) is a registered Member of National Stock Exchange of India Limited, Bombay
Stock Exchange Limited, Metropolitan Stock Exchange Limited, Multi Commodity Exchange of India Ltd and National Commodity &
Derivatives Exchange Ltd It is also registered as a Depository Participant with CDSL and Portfolio Manager and Investment Adviser with
SEBI. It also has registration with AMFI as a Mutual Fund Distributor. Angel Broking Limited is a registered entity with SEBI for Research
Analyst in terms of SEBI (Research Analyst) Regulations, 2014 vide registration number INH000000164. Angel or its associates has not
been debarred/ suspended by SEBI or any other regulatory authority for accessing /dealing in securities Market. Angel or its
associates/analyst has not received any compensation / managed or co-managed public offering of securities of the company covered
by Analyst during the past twelve months.
This document is solely for the personal information of the recipient, and must not be singularly used as the basis of any investment
decision. Nothing in this document should be construed as investment or financial advice. Each recipient of this document should
make such investigations as they deem necessary to arrive at an independent evaluation of an investment in the securities of the
companies referred to in this document (including the merits and risks involved), and should consult their own advisors to determine
the merits and risks of such an investment.
Reports based on technical and derivative analysis center on studying charts of a stock's price movement, outstanding positions and
trading volume, as opposed to focusing on a company's fundamentals and, as such, may not match with a report on a company's
fundamentals. Investors are advised to refer the Fundamental and Technical Research Reports available on our website to evaluate the
contrary view, if any
The information in this document has been printed on the basis of publicly available information, internal data and other reliable
sources believed to be true, but we do not represent that it is accurate or complete and it should not be relied on as such, as this
document is for general guidance only. Angel Broking Limited or any of its affiliates/ group companies shall not be in any way
responsible for any loss or damage that may arise to any person from any inadvertent error in the information contained in this report.
Angel Broking Limited has not independently verified all the information contained within this document. Accordingly, we cannot testify,
nor make any representation or warranty, express or implied, to the accuracy, contents or data contained within this document. While
Angel Broking Limited endeavors to update on a reasonable basis the information discussed in this material, there may be regulatory,
compliance, or other reasons that prevent us from doing so.
This document is being supplied to you solely for your information, and its contents, information or data may not be reproduced,
redistributed or passed on, directly or indirectly.
Neither Angel Broking Limited, nor its directors, employees or affiliates shall be liable for any loss or damage that may arise from or in
connection with the use of this information.
Disclosure of Interest Statement
Axis Bank
1. Financial interest of research analyst or Angel or his Associate or his relative
No
2. Ownership of 1% or more of the stock by research analyst or Angel or associates or relatives
No
3. Served as an officer, director or employee of the company covered under Research
No
4. Broking relationship with company covered under Research
No
Ratings (Based on expected returns
Buy (> 15%)
Accumulate (5% to 15%)
Neutral (-5 to 5%)
over 12 months investment period):
Reduce (-5% to -15%)
Sell (< -15)
Feb 13, 2019
7